Cruises LEFE CYBER
GREEN EDGE
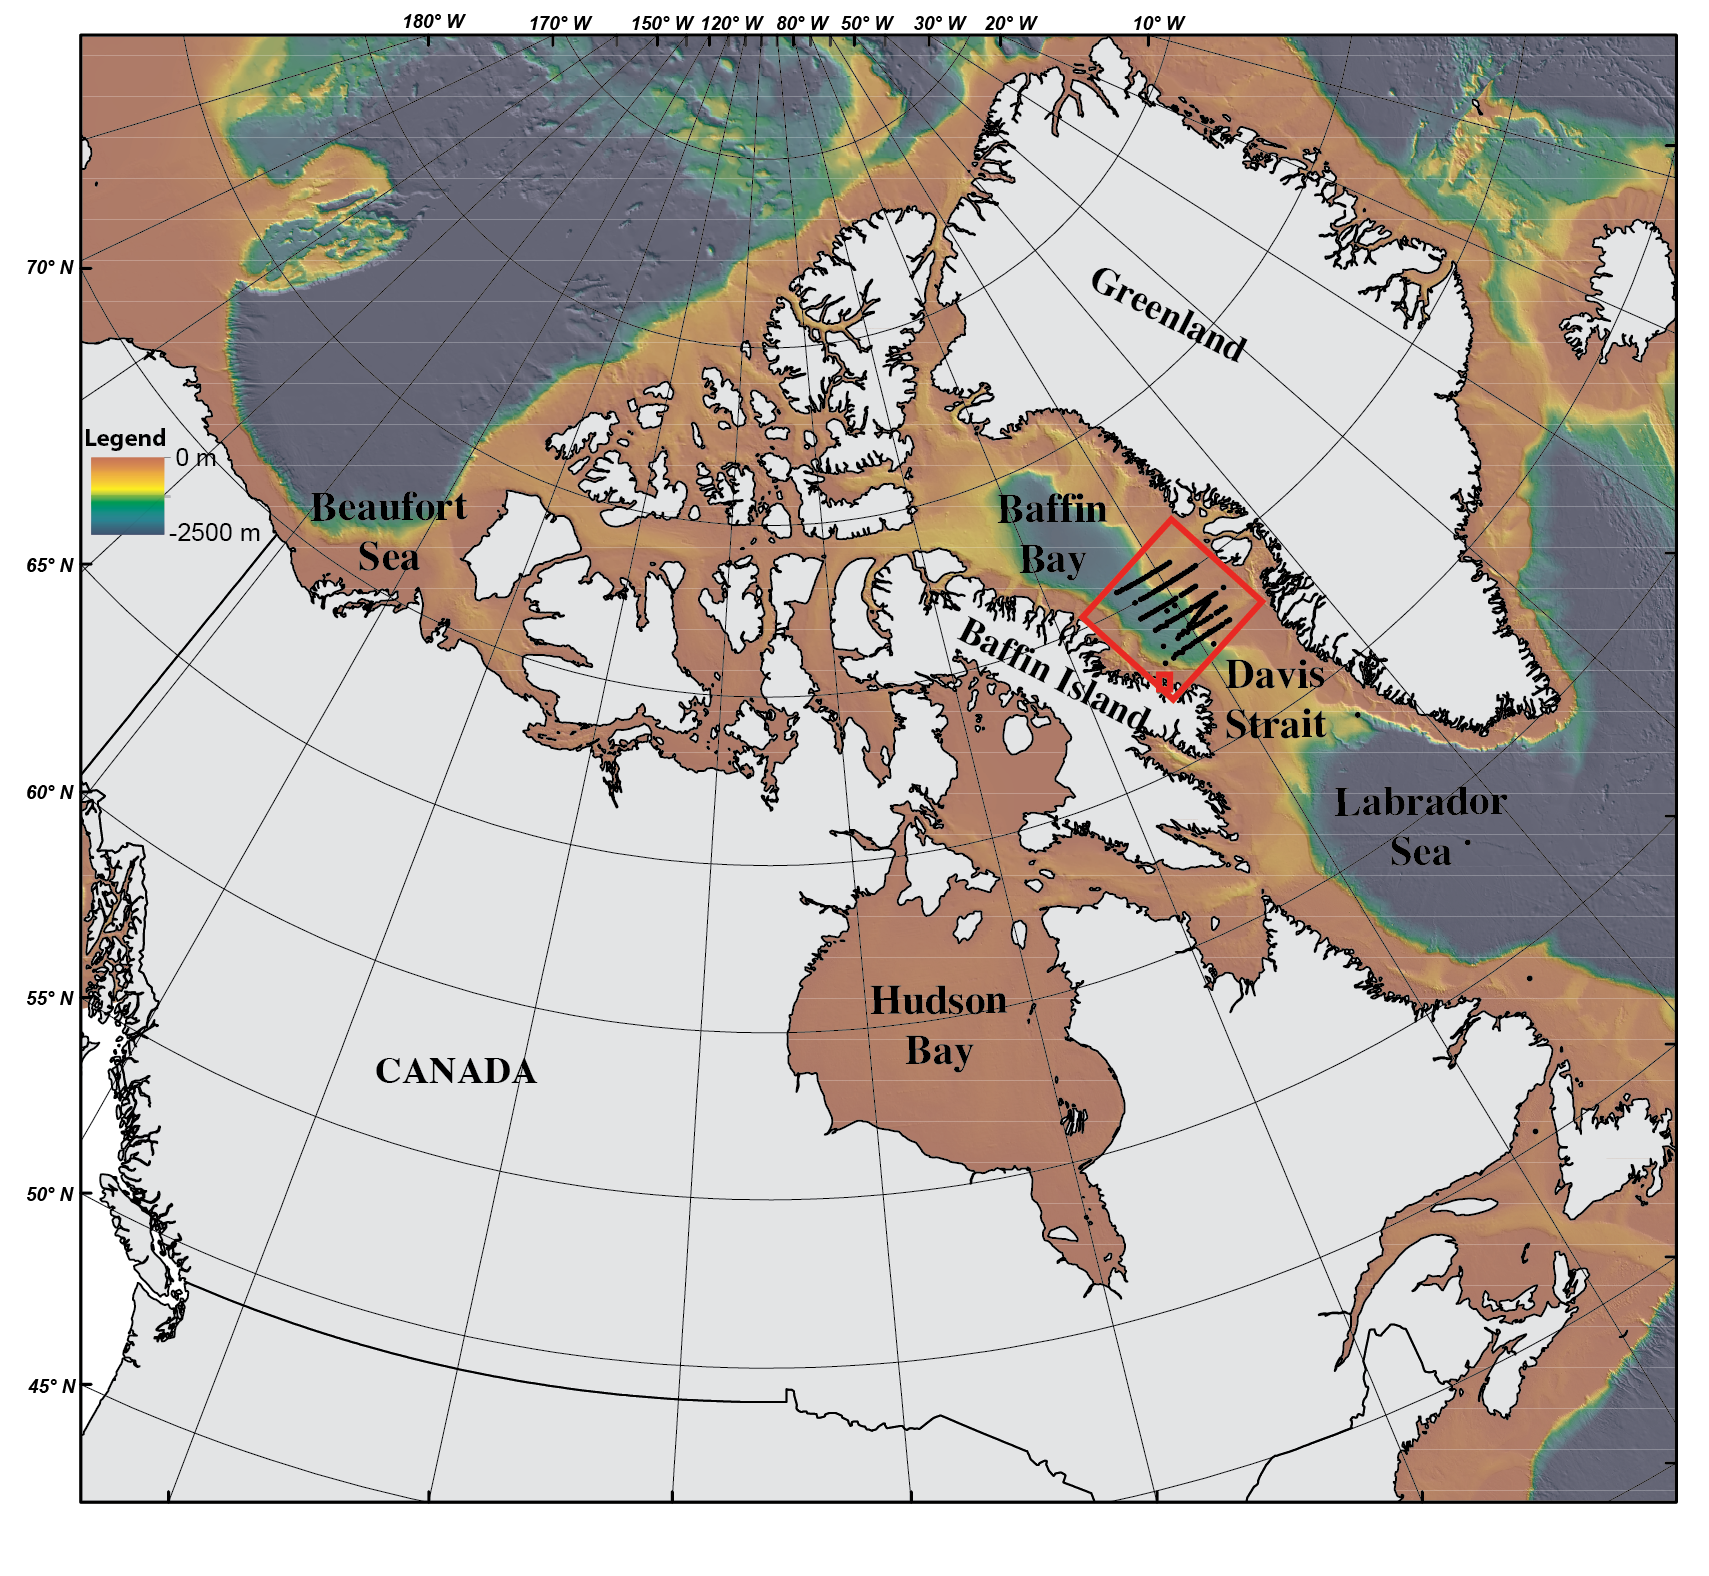
Green edge site: the bigger red square illustrate the sampling grid area for the ship-based cruise and the smaller red square indicate the location of the island of Qikiqtarjuaq. Bathymetric data compiled from the International Bathymetric Chart of the Arctic Ocean (IBCAO). Acknowledgment: Gabriel Joyal and Patrick Lajeunesse, Laboratoire de géosciences marines, Institut national de recherche scientifique (INRS). Data collected from 2003-2016 onboard the CCGS Amundsen within the ArcticNet research program. (Zoom)
Location of the Green Edge Ice Camp site [67°28.784N, 063°47,372W]. Bathymetric data compiled from the International Bathymetric Chart of the Arctic Ocean (IBCAO, V3). Courtesy of E. Rehm
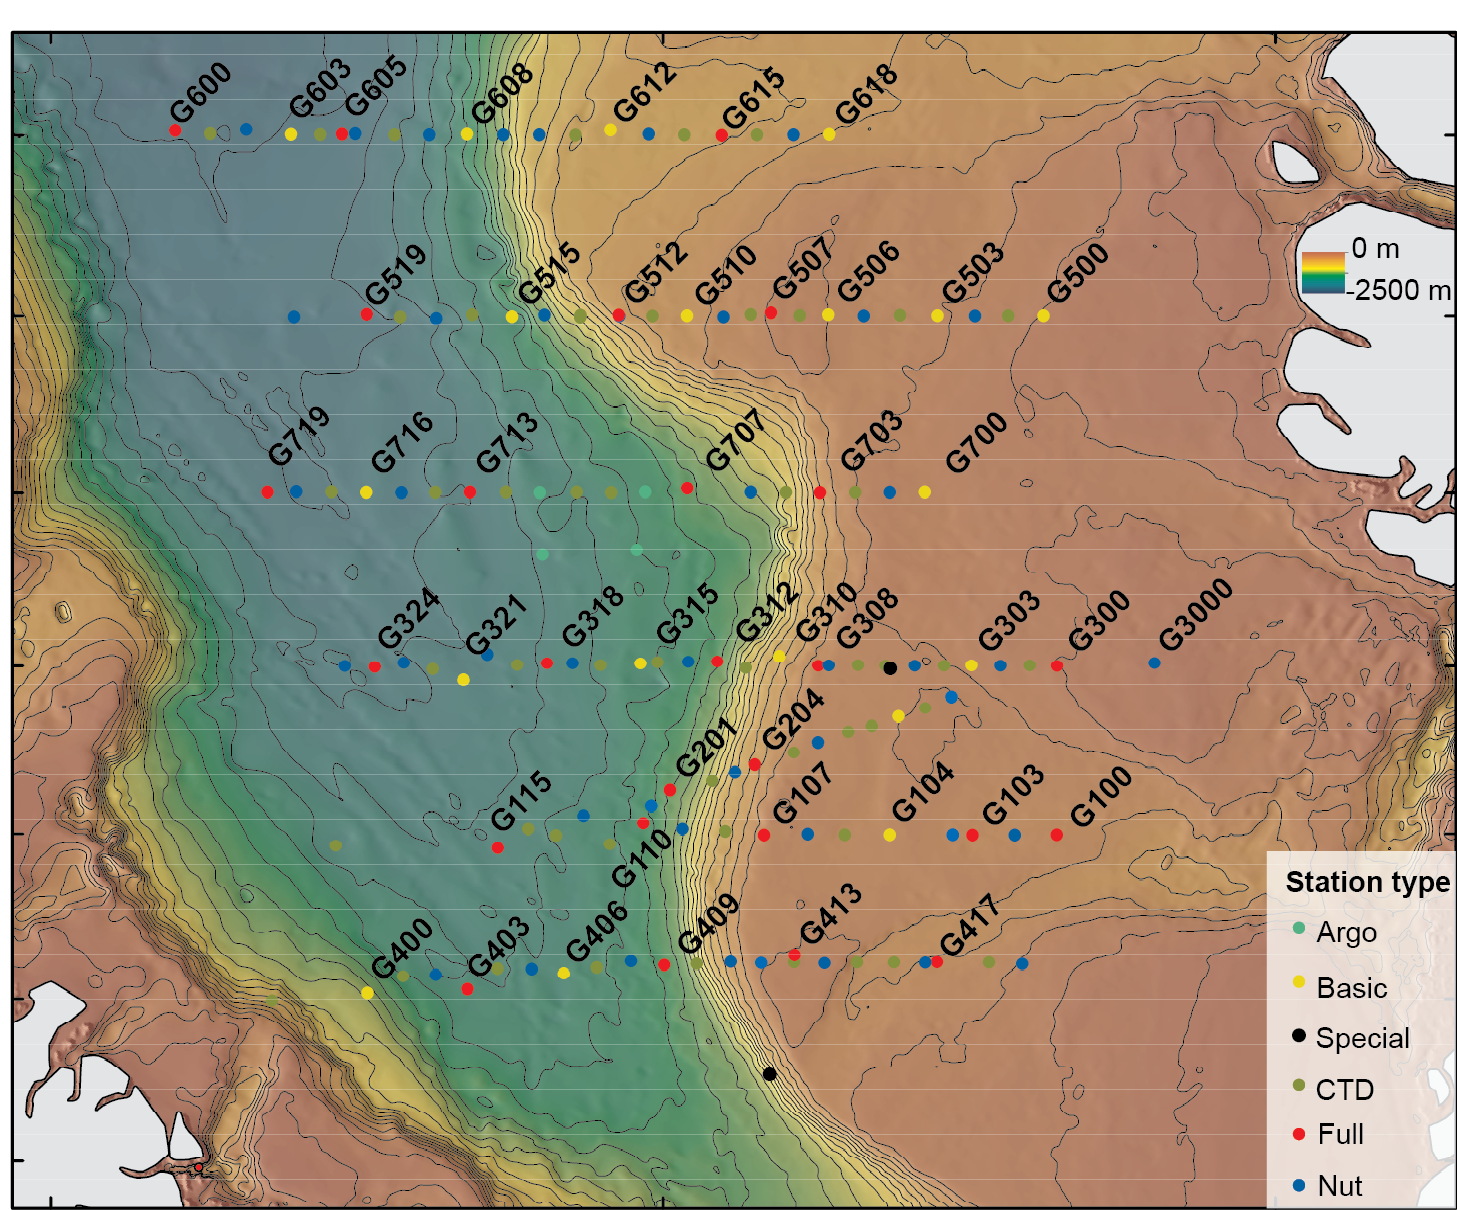
Amundsen stations location
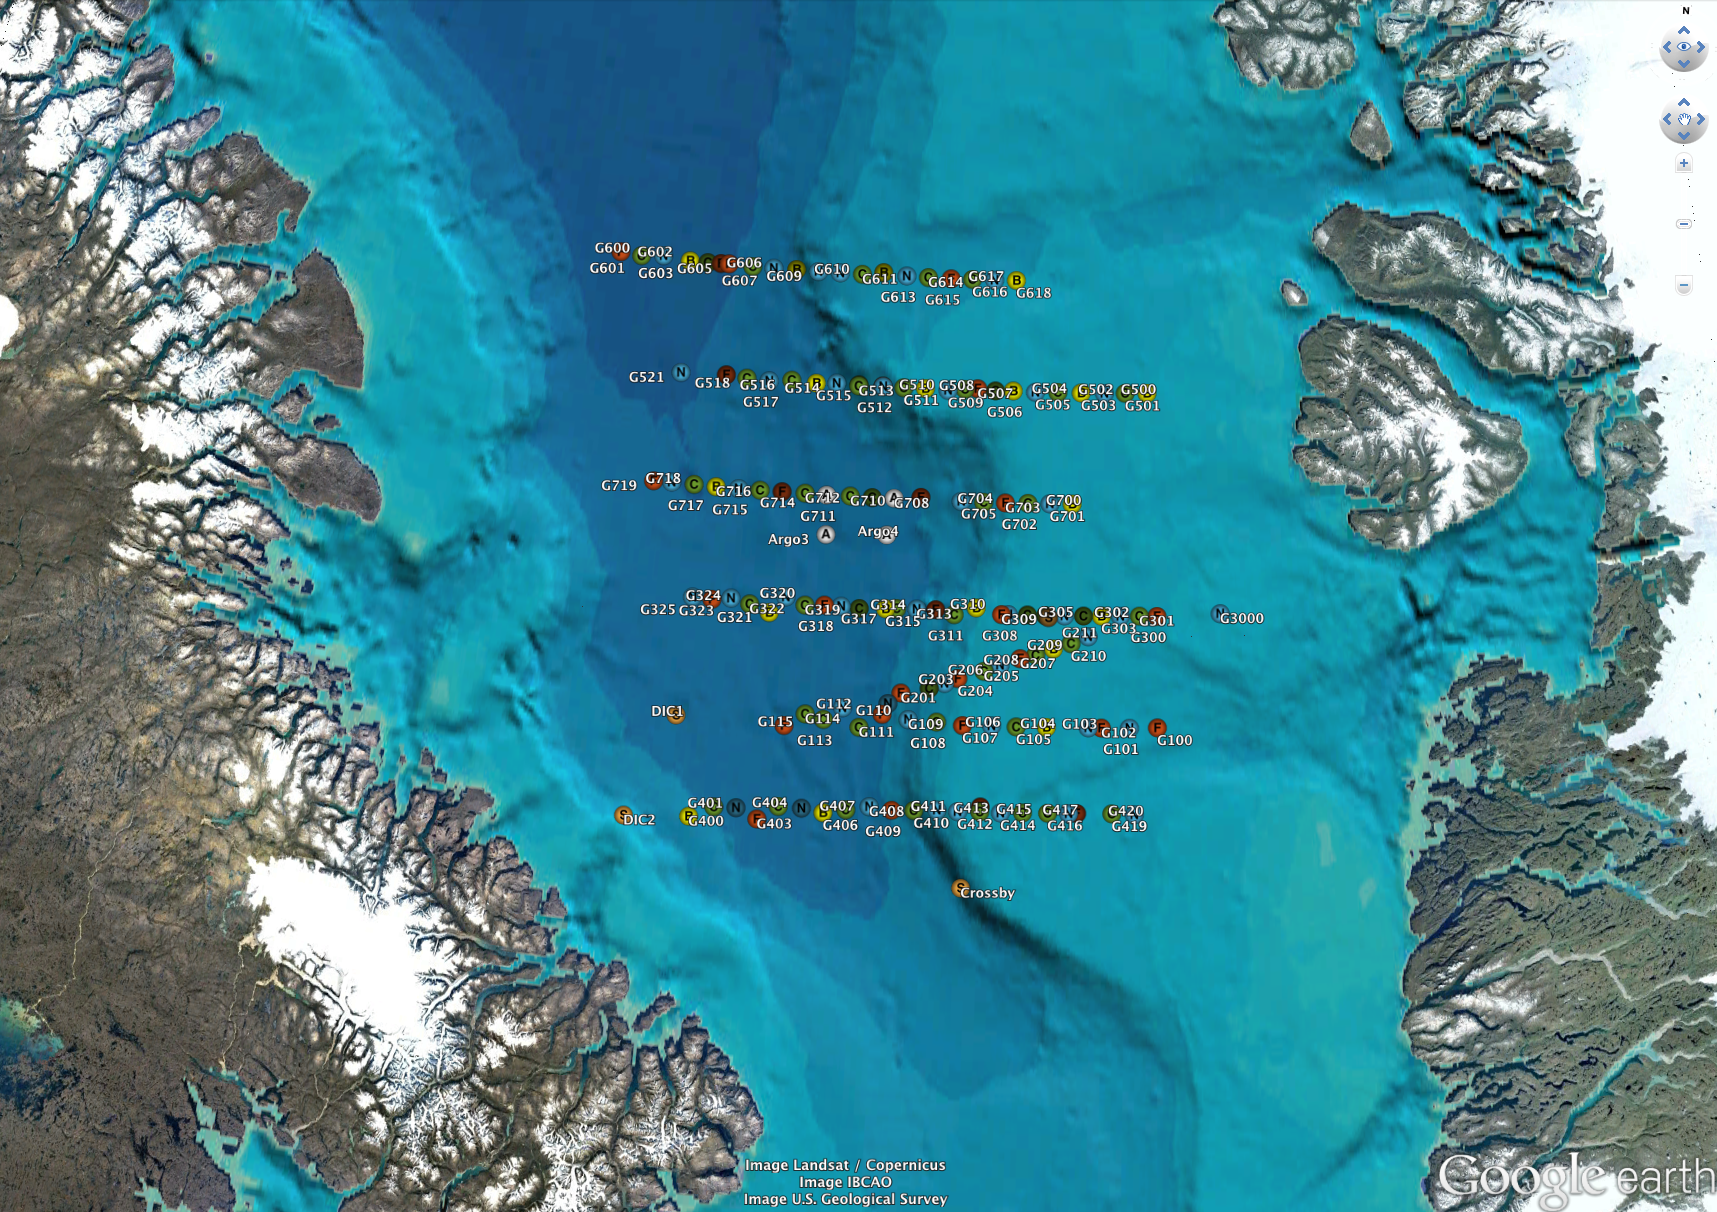
Amundsen stations ( the kmz file)
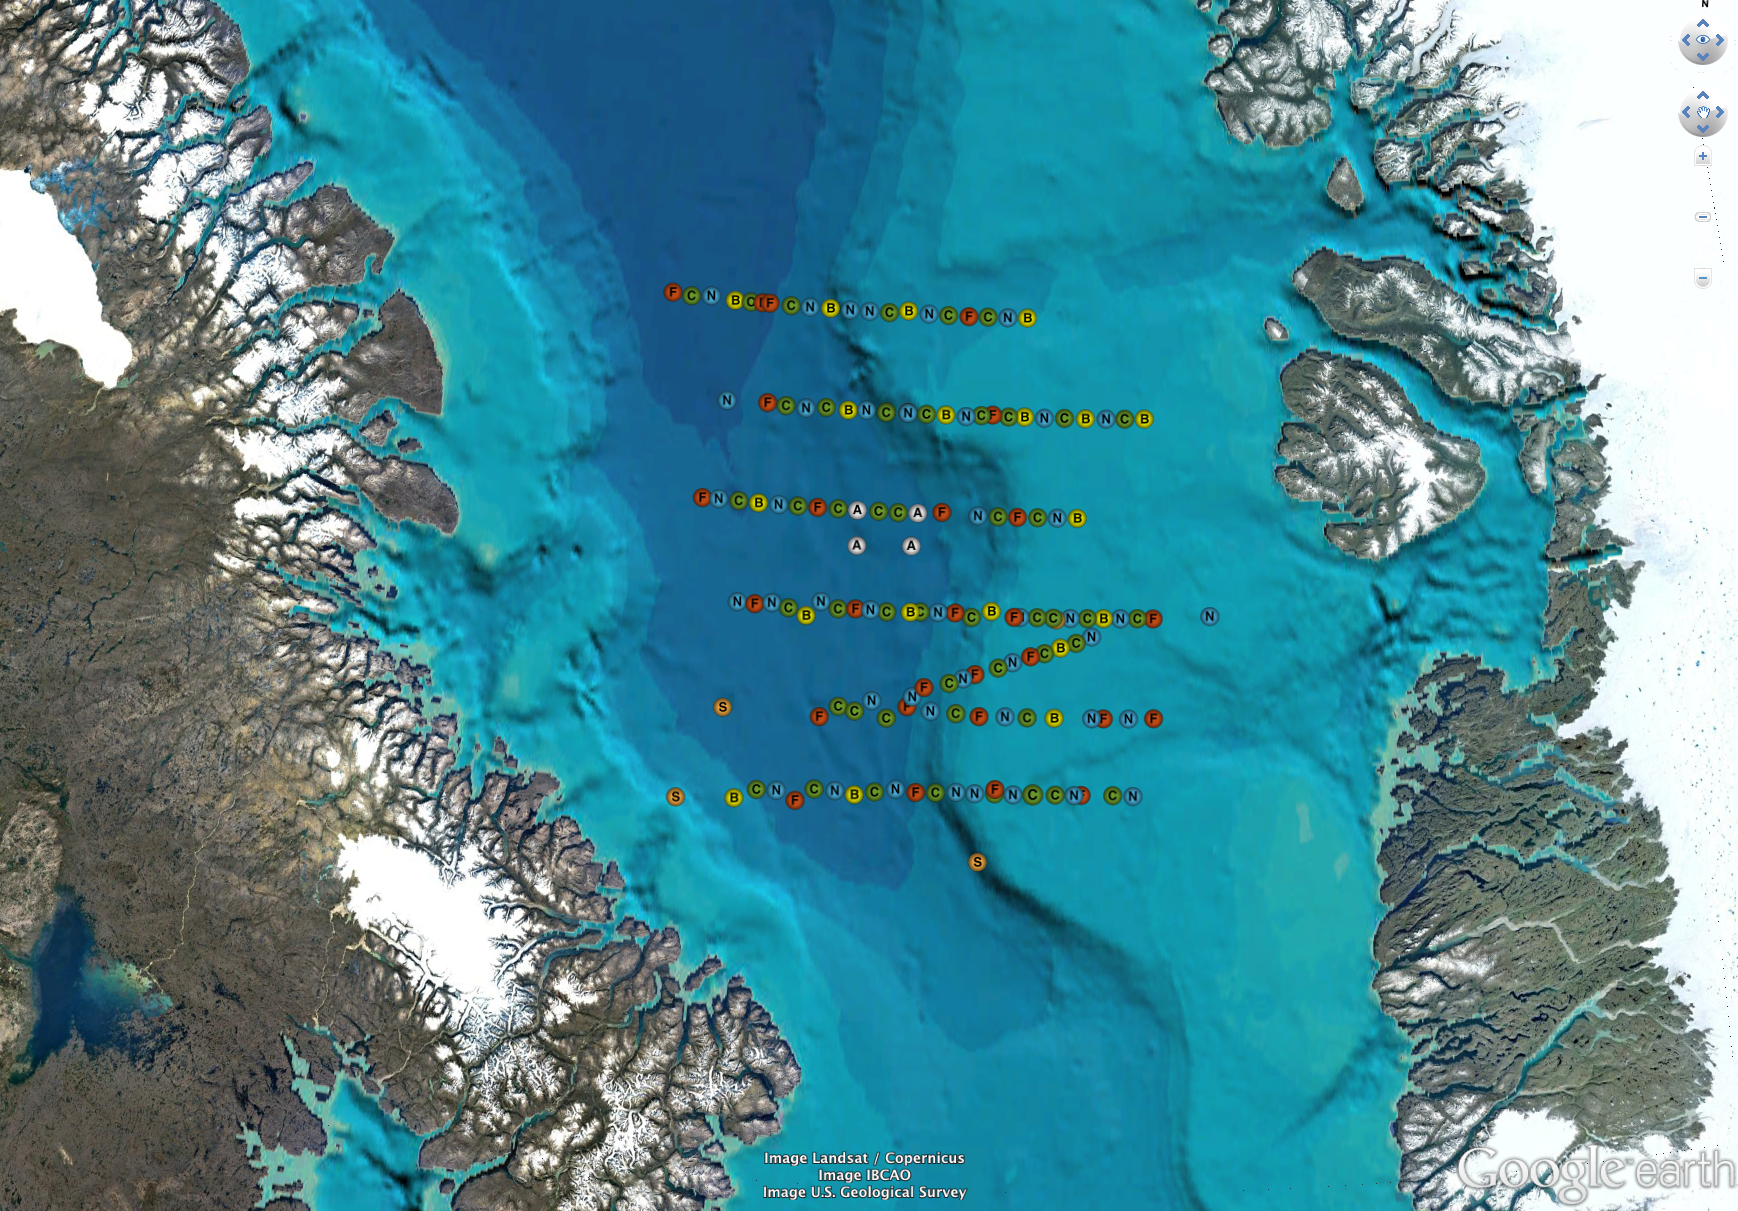
Amundsen stations no label ( the kmz file)
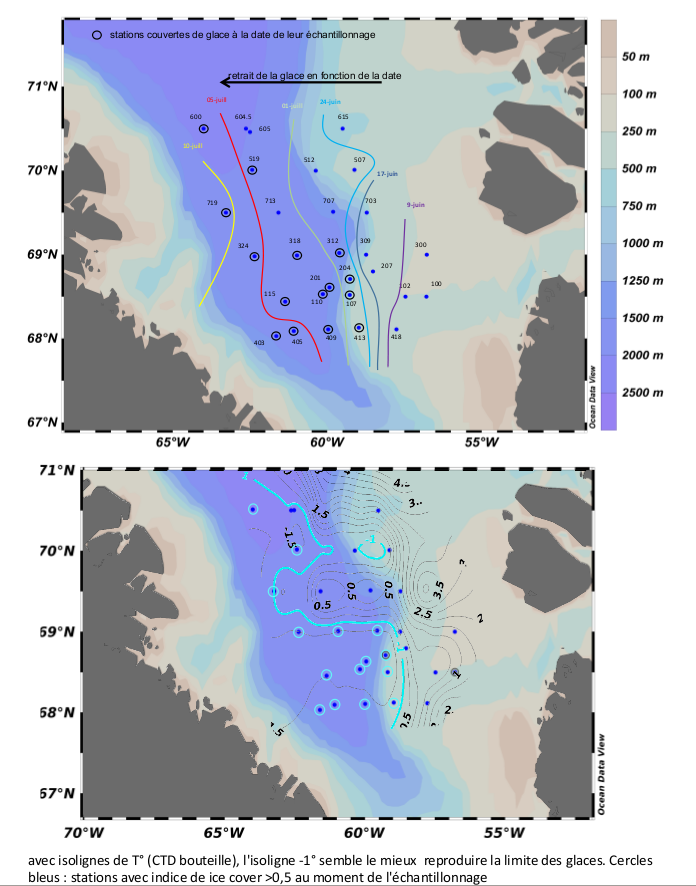
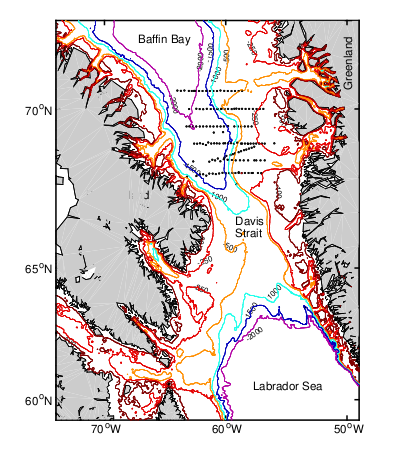
Top panel: Green-Edge sampling stations (where silicium products have been sampled). Station numbers within black circle indicate station was covered in ice at sampling time. Lines indicate ice edge limit at corresponding date (an ice-coverage index of above 50% has been used for set line determination. Courtesy of Karine Leblanc. Bottom panel: Green-Edge sampling stations (where silicium products have been sampled). Temperature isolines are taken from the rosette bottle files. Station numbers within blue circle indicate station was covered in ice at sampling time. -1C isoline does indicate the best limit for ice coverage (index > 0.5). Courtesy of Karine Leblanc. ( pdf file)
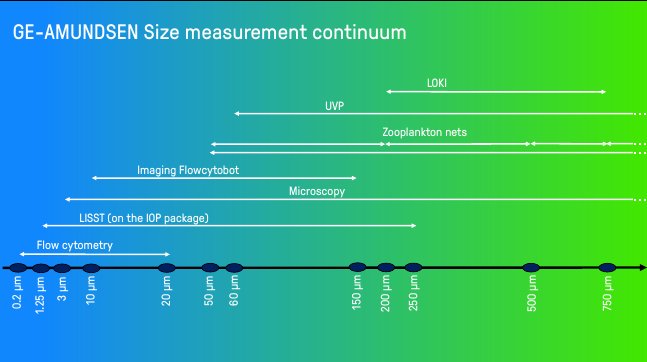
Flow cytometry analysis
D. Vaulot - Station Biologique de Roscoff.
Funding Agencies
International Programs