|
|
|
The 3 subsections below briefly
summarize the set of measurements that are performed
offshore either from the ship or from the buoy, and
at the coastal site from the sunphotometer.
Summary
table of parameters collected (Word doc 185 kB) |
| Ship
measurements |
The
set of parameters directly derived from the measurements
made by the SeaWiFS Profiling Multichannel Radiometer
(SPMR) to 200m depth and the SeaWiFS Multichannel
Surface Radiometer (SMSR) will be (with Λs meaning
the band set, i.e., (380, 411, 443, 456,
491, 510, 532, 560, 620, 665, 683, 705 779 and 865)
nm.
- Above surface radiometers: Es(Λ);
and
- In-water radiometers: Ed(Λ), Eu(Λ).
From profiling with
the CTD rosette to 400m, the parameters collected
will be chlorophyll fluorescence, CDOM fluorescence,
attenuation and absorption coefficients (412, 440,
488, 510, 532, 555, 630, 676, 715 nm), bb(440), bb(532), bb(650),
temperature, conductivity and derived salinity, oxygen
concentration, and surface PAR.
Samples are collected
and filtered for subsequent determination of the
phytoplankton pigments and particulate absorption. Water samples are also collected for subsequent lab measurements of CDOM absorption.
Back
to top |
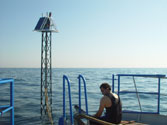
| Buoy
measurements |
The
set of parameters directly derived from the measurements
will be (with λ meaning the band set, i.e.,
412, 443, 490, 510, 560, 665 and 683 nm) :
- Above surface : Es(λ);
- At 4 meters : Ed(λ), Eu(λ), Lu(λ),
chlorophyll fluorescence; beam attenuation (660
nm)
- At 9 meters : Ed(λ), Eu(λ), Lu(λ),
chlorophyll fluorescence, beam attenuation (660
nm), bb(443) and bb(560),
conductivity, temperature, pressure (CTD), two-axis
tilt and compass.
From these measurements,
various AOPs or IOPs might be derived, as the diffuse
attenuation coefficients for upwelling and downwelling
irradiance, Ku and Kd,
the attenuation coefficient for upwelling radiance, KL,
the diffuse reflectance just below the sea surface, R,
the nadir Q-factor, Eu/Lu,
the attenuation and backscattering coefficients, c and bb.
The absorption coefficient, a, will be tentatively
derived through inversion of the AOPs (using for
instance Kd and R, assuming
that they are accurately derivable from the 2 measurement
depths of the buoy; e.g., see Gordon and
Boynton, 1997; Leathers and McCormick, 1997, Barnard et
al., 1999). Table 1 below shows how the data
acquired on the system fits to the band sets of several
ocean color sensors.
MERIS
10 nm |
POLDER-3
20 nm |
SeaWiFS
20 nm |
MODIS
10 nm |
412nm |
|
0 |
0 |
443 |
0 |
0 |
0 |
490 |
0 |
0 |
-2 |
510 |
|
0 |
|
560 |
+5 |
-5 |
-5 |
665 |
+5 |
+5 |
+2 |
683 |
|
|
0 |
Table 1. The
MERIS wavelengths, as acquired on the buoy (leftmost
column), and the spectral shift of other satellite
bands with respect to those of MERIS . The second
row gives the channel bandwidths. This table prepared
from the IOCCG (1998) report .
Back
to top |
| Coastal
measurements |
|
|
|
|
|