Cruises LEFE CYBER

OUTPACE
Oligotrophy to UlTra-oligotrophy PACific Experiment


Click on the picture to enlarge
Download image (.eps)
Download image (.pdf)

Click on the picture to enlarge
Download image (.eps)
Download image (.pdf)

Click on the picture to enlarge
Download image (.eps)
Download image (.pdf)

Quasi-Lagrangian Surface Chlorophyll-a concentration (mg m-3) during the OUTPACE cruise.
The satellite data are weighted in time by each pixel's distance from the ship's position for the entire cruise. The white line shows the vessel route (data from the hull-mounted ADCP positioning system). Coral reefs and coastlines are shown in black, land is grey, and areas of no data are left white. The positions of the short (long) duration stations are shown by cross (plus) symbols.
The ocean color satellite products are produced by CLS.
Figure courtesy of A. De Verneil (02/06/2017).


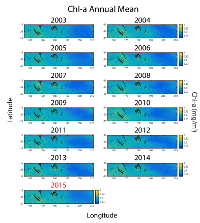
CHLA annual mean (pdf)


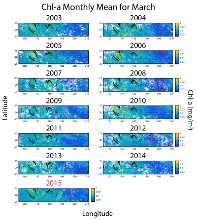
     CHLA monthly march mean (pdf)


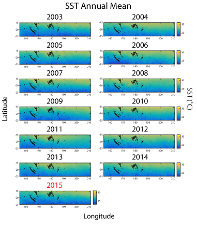
SST annual mean (pdf)


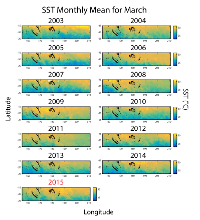
     SST monthly march mean (pdf)


Chl-a (mg m-3) and SST (deg C) annual and monthly March mean values in the OUTPACE region. Data come from the MODIS Aqua satellite mission, available from the NASA Ocean Biology Processing Group website (https://oceancolor.gsfc.nasa.gov).


11-Feb-2015 /  © PROOF/DataBase/CS)