
FROM WEB SITE Gep&CO (may 2007)
Geochemistry, Phytoplankton, and Color of the Ocean
GeP&CO
Analytical methods used in the GeP&CO experiment
Table of contents
II.- Sampling conditions at sea
III.- Measurement of nutrients concentration
IV.- Measurement of total CO2 and alkalinity
V.- Photosynthetic pigments measurements using HPLC
VI.- Spectrofluorometric measurements of chlorophyllous pigments
VII.- Spectrofluorometric measurements of phycoerythrin
VIII.- Flow cytometry counts of picoplankton
IX.- counts of Coccolithophorids
XI.- Light absorption by colored dissolved organic matter (CDOM)
The Geochemistry, Phytoplankton and Color of the Ocean program (GeP&CO) is a 3 year long program that aims to describe and understand the variability of phytoplankton populations in the ocean, and their consequences on the oceans geochemistry. GeP&CO is part of the French program Processus Océaniques et Flux (PROOF) supported by several French institutes : INSU/CNRS, IRD, CNES, and IFREMER. The observations are made quarterly across the North Atlantic, along the eastern coast of the United states, through the Caribbean Sea to Panama, and across the equatorial and tropical South Pacific to New Zealand and New Caledonia. GeP&CO uses the commercial trips of merchant ship Contship London, owned by MS "Alexandra Rickmers" Schiffsbeteiligungsgesellschaft mbH & Co in Hamburg. The first cruise took place in November-December 1999, and the last one is scheduled to start in June of 2002.
The observations correspond to three main categories of objectives. The characterization of phytoplankton populations uses mainly photosynthetic pigments determinations, and also cells counts made either automatically by flow cytometry, or using a microscope. Geochemical measurements consist of determinations of nutrients and of total CO2 and alkalinity that are subject to changes caused by biological activity. Optical measurements are also made (surface ocean reflectance, light absorption by particles and by dissolved organic matter) in order to build a database that will be used to investigate the relationships between ocean properties and satellite detected ocean color.
We describe here the protocols and analytical procedures that are used to produce the GeP&CO data. A method that aims to measure the concentration of phycoerythrin is still being developed and is only briefly mentioned : it uses fluorescence excitation- emission spectra of seawater volumes concentrated on membrane filter.
II.- Sampling conditions at sea
A cabin on the main deck has been kindly lent to the GeP&CO experiment, for the purposes of seawater filtration, samples conditioning and storage, and also for the spectrophotometric measurement of spectra of light absorption by colored dissolved organic matter. Seawater samples are taken every 4 hours (i. e. 6:00, 10:00, 14:00, 18:00, and 22:00, local time ; sampling at 2:00 is skipped) in the engine room, at the intake of the cooling system, at about 5 m depth, where a thermosalinograph has been installed (Delcroix et al., 1998). The duration of the trip is about 38 days. Then, it takes another 38 days until the ship calls again in Le Havre, and from one week to two months before measurements are made. Thus, storage is generally between 50 and 140 days long. All samples (except the flasks for total CO2 and alkalinity measurements) are stored at -80°C, in order to prevent degradation of biological and optical properties (Sosik, 1999).
Seawater samples ( 20 ml, in polyethylene tubes, poisoned with mercury chloride and kept frozen at -80°C until analysis) are processed on a 4 channels Technicon AAII analyzer.
Phosphates react with ammonium molybdate and antimony oxytartrate to form a yellow phosphomolybdic complex. The later is then reduced by ascorbic acid giving a blue coloration that is proportional to phosphate concentration.
Colorimetry is also used for the determination of nitrite that gives a red compound with sulfanilamide and ethylenediamine naphtyl. Nitrate concentration is the difference between nitrate + nitrite (after nitrate has been reduced into nitrite by ammonium chloride in presence of copper treated cadmium) and nitrite alone.
Silicates (in practice, mostly orthosilicic acid) react with ammonium molybdate giving a yellow silicomolybdic complex. Oxalic acid is used to remove phosphate and AsO4 from this complex. Finally, after reduction using metol (??), a blue coloration appears that is used to estimate silicate concentration.
Final concentrations (µg/l) are obtained by comparison with standards of NO2, NO3, PO4 and Si(OH)4 processed in the same way.
Seawater is taken directly into 0.5 L glass bottles in which it is stored until analysis in the laboratory. Seawater is allowed to overflow for about one minute, avoiding air bubbles, and 1 ml of water saturated with mercury chloride is added for preservation. The bottle is then stopped with a glass stopper smeared with Apiezonâ grease, leaving one ml of air inside to prevent against increase of volume sample with temperature. These bottles are stored at room temperature until taken to the Laboratoire de Biogéochimie et de Chimie Marines (LBCM). There, they are analysed using addition of acid and potentiometry, according to Goyet et al. (1991).
For cruises GeP&CO_A to _C, correction for salinity was made using salinity data recorded by a thermosalinograph onboard of Contship London (http://www.ird.nc/ECOP/siteecopfr/cadres.htm"). For the other cruises, seawater samples were taken for salinity measurements in the same time as those for total carbonate and alkalinity, and these measurements are used to account for the effect of salinity.
V.- Photosynthetic pigments measurements using HPLC
Filtration of seawater samples is made on Whatman GF/F filters, 25 mm in diameter, using vacuum maintained below 0.25 atm. Filtration is stopped and filtered volume is measured after one hour filtration time, in order to avoid damage to the pigments that may occur when the filters are clogged and filtration takes too long. The volume that is filtered under such conditions is usually about 2.5 or 3 liters in clear waters, and sometimes only 1.5 liter in rich coastal waters. Filters are then folded with the phytoplankton cells inside, inserted in a numbered plastic envelope, and stored at -80°C. They are recovered at the next call in Le Havre, transported to LODyC in Paris, and later to the Station Marine dArcachon using containers with dry ice.
Measurements are made in Arcachon using the high performance liquid chromatography equipment of the Laboratoire d'Océanographie Biologique. This equipment, a Thermo Separations HPLC system, has a binary pump, a 3 µm pore size Licospher (endcapped) C-8, column, 250 x 4 mm, maintained at 30°C, and a Thermo Separations UV LP 6000 diode array detector. A refrigerated automat can handle several samples allowing measurements at night.
The method is adapted from Goericke and Repeta (1993). Filters are extracted in 2 ml of 100% methanol during 1 hour at 4°C in obscurity after ultrasonication (15 s). Extracts are filtered through 0.2µ filters to remove all solid particles, and then loaded into the autosampler which is capable of cooling pigments extracts to 2°C and adding 1 M ammonium acetate (2:1, v/v) prior to injection. Pigments are separated at a flow rate of 0.6 ml/min. The proportion of solvents varies linearly along the separation, programmed as follows (minute; % solvent A; % solvent B) : (0;75;25), (1;50;50), (20;30;70), 25;0;100), (35;0;100), (40;0;75). Solvent A is 70:30 (v/v) methanol: 1 M ammonium acetate and solvent B is 100% methanol. The column is then restored to original conditions during 10 min. Pigments are detected using absorption at 440 nm.
Numeric chromatograms are recorded and processed using the PC1000 Thermo Separations software. Calibration is made using pigments standards purchased from DHI Water and Environment, Horsholm, Denmark.
VI.- Spectrofluorometric measurements of chlorophyllous pigments
Filtration and filters storage are made in the same way as above for the HPLC measurements, the main difference being that the filtered volume is only half a liter, which takes usually less than 10 minutes and exerts minimal damages to the cells. Measurements are made at LODyC in Paris, using a F-4500 Hitachi spectrofluorometer. Filters are first ground in 10 ml glass tubes with 6 ml of 90% acetone, using a scratched glass rod, the tubes are stopped and extraction is allowed overnight, at darkness, in a refrigerator. After extraction, the content of each tube is centrifuged, one ml is transferred in a square 1 cm x 1 cm quartz cell, and fluorescence emission excitation spectra are measured in the spectrofluorometer, operating in ratio mode. Measuring parameters are as follows : excitation wavelength varies from 390 to 480 nm, with a 3 nm step, and excitation slit adjusted to 5 nm, and emission is measured from 620 to 720 nm at a 4 nm step, with emission slit adjusted to 10 nm. This yields 31 x 26 = 806 fluorescence measurements for each sample.
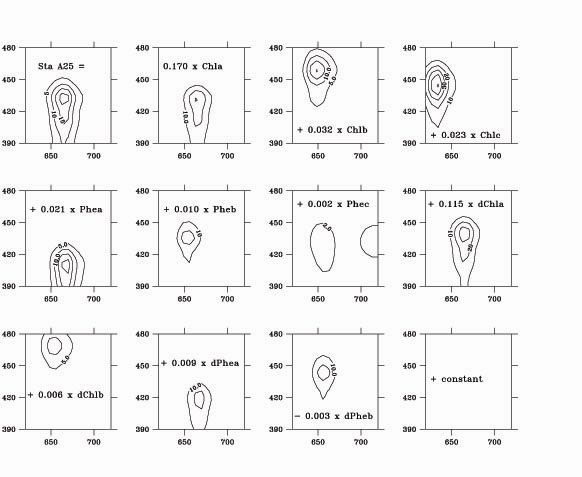
Computation of the concentration of chlorophyllous pigments is then made according to Neveux and lantoine (1993), assuming that each one of these 806 fluorescence values is the sum of the contribution of n distinct pigments, with concentrations C1, C2 Cn. The Cis are then estimated as the values that minimize :
(1)
where F is the fluorescence of the sample at wavelengths l exc and l em, and
is the fluorescence of unit concentration of pigment i at the same wavelengths determined on pure pigments to calibrate the instrument (figure 1). The main improvement to the method first described by Neveux and Lantoine (1993) is the number of fluorescence measurements which is now 806 instead of 24, thus allowing a better discrimination of pigments whose fluorescence properties are only slightly different.
We presently use n = 13 pigments : chlorophyll a, chlorophyll b, chlorophyll c2 , chlorophyll c3, pheophytin a, pheophytin b, pheophytin c2, pheophytin c3, divinyl-chlorophyll a, divinyl-chlorophyll b, divinyl-pheophytin a, divinyl-pheophytin b, and a fictitious pigment with a flat fluorescence excitation-emission spectrum that accounts for background signal and extract turbidity. Concentrations are presented in this order in the files of results that can be accessed to on this website ; the concentration for the fictitious pigment is not given. New pigments can be introduced into the numerical analysis, if standards become available. Numerically minimizing Q2 sometimes gives small negative concentrations for some pigments that are at very low concentration. In such cases, the computation is made again without these pigments, until only positive concentrations are found. Concentrations are given in milligrams per cubic meter.
Figure 1 : principle of the numerical determinations of chlorophyll by spectrofluorometry.
These measurements are calibrated versus pigments standards purchased from DHI Water and Environment, Horsholm, Denmark. Divinyl chlorophyll b has been prepared, isolated and quantified by Jacques Neveux. The evolution of the calibration through the GeP&CO experiment is presented and discussed in derivefluo.pdf
VII.- Spectrofluorometric measurements of phycoerythrin
Dandonneau, Yves, et Niang, A. (2007), Assemblages of phytoplankton pigments along a shipping line through the North Atlantic and tropical Pacific. Progress in Oceanography, 73 (2): 127-144.
(updated on 2008 nov 25)
VIII.- Flow cytometry counts of picoplankton
1.5 ml seawater samples are placed in cryotubes and poisoned with 1 glutaraldhyde, then stored at -80°C until analysis in the laboratory. The flow cytometry measurements are then performed within two hours after de-freezing on 0.1 ml water volumes with a fluorescence activated cell sorter scan (FACScan) flow cytometer (Becton-Dickinson). Bacteria counts were made on a separate subsample, treated with Syber green. Filtered seawater served as sheath fluid, and 2µ beads were used as standards (Blanchot and Rodier, 1996). The data were treated with the Becton-Dickinson LYSYS II software, and analysed with the cytowin software (Vaulot, 1989) for the identification and count of Prochlorococcus spp., Synechococcus spp., picoeucaryotes and bacteria.
IX.- counts of Coccolithophorids
Filtration of 1.5 L of seawater is made onboard on Millipore nitrocellulose AA filters, 25 mm in diameter. The filters are then stored in biopsy boxes and kept dry until identification and counting of Coccolithophorids cells using a microscope, at magnification 1250 (Eynaud et al., 1999).
Seawater samples are filtered (approximate volume 2 L) at sea and stored at -80°C in biopsy boxes until analysis in the laboratory. Filters are Whatman GF/F, 25 mm in diameter. The spectral absorption of light by algae is measured in a Beckman DU 640 spectrophotometer, placing the filter close to the instrument photoreceptor window, as in Dupouy et al. (1997). The measurements are made in two steps : first, absorption of light by the filter is measured from 400 to 800 nm (step 1 nm), then, photosynthetic pigments are removed using hot methanol (Kishino, 1985), the filter is placed back in the spectrophotometer, in the same position, and absorption is measured again. The absorption of light by algae is the difference between the two measurements. In principle, the measurement after pigments removal by methanol represents absorption by particles. However, the filters collected during the GeP&CO cruises had a residual red coloration probably caused by the ships antifouling painting, and this later measurement will not be included in the GeP&CO database.
XI.- Light absorption by colored dissolved organic matter (CDOM)
The method is adapted from Mitchell et al. (2002). Seawater samples (approximate volume 100 ml) are filtered on Nuclepore filters, 25 mm in diameter, 0.1 micron pore size. The first 2 or 3 ml are used to rinse the filter and are eliminated. The remnant filtered seawater is kept in brown glass bottles kept at ambient temperature at darkness. Maximum storage duration is 16 h, from 6:00 am to 10:00 pm. The samples taken on a given day are all processed at the end of this day. Light absorption spectra are measured from 200 to 800 nm using 10 cm light path cells, in a Beckman DU 640 spectrophotometer. A baseline obtained using Milli-Q water is subtracted. Quality of this reference water is checked versus absorption by air.
References
Blanchot, J. and M. Rodier 1996. picophytoplankton abundance and biomass in the western tropical Pacific Ocean during the 1992 El Niño year : results from flow cytometry. Deep-Sea Research I 43: 877-895.
Delcroix, T., L. Gourdeau, and C. Hénin 1998. Sea surface salinity changes along the Fiji-Japan shipping track during the 1996 La Niña and 1997 El Niño period. Geophysical Research Letters 25: 3169-3172.
Dupouy, C., J. Neveux, and J.M. André 1997. Spectral absorption coefficient of photosynthetically active pigments in the equatorial Pacific Ocean (165°E-150°W). Deep Sea Research II 44: 1881-1906.
Eynaud, F., J. Giraudeau, J.-J. Pichon, and C.J. Pudsey 1999. Sea-surface distributions of coccolithophores, diatoms, silicoflagellates and dinoflagellates in the South Atlantic Ocean during the late austral summer 1995. Deep-Sea Research I 46: 451-482.
Goericke, R. and D.J. Repeta 1993. Chlorophylls a and b and divinyl chlorophylls a and b in the open subtropical North Atlantic Ocean. Marine Ecology Progress Series 101: 307-313.
Goyet, C., C. Beauverger, C. Brunet, and A. Poisson 1991. Distribution of carbon dioxide partial pressure in surface waters of the southwest Indian Ocean. Tellus 43B: 1-11.
Kishino, M., M. Takahashi, N. Okami, and S. Ichimura 1985. Estimation of the spectral absorption coefficients of phytoplankton in the sea. Bulletin of Marine Science 37: 634-642.
Lantoine, F. and J. Neveux 1997. Spatial and seasonal variations in abundance and spectral characteristics of phycoerythrins in the tropical Northeastern Atlantic ocean. Deep-Sea research I 44: 223-246.
Mitchell, B.G., M. Kahru, J. Wieland, and M. Stramska 2002. Determination of spectral absorption coefficients of particles, dissolved material and phytoplankton for discrete water samples. NASA/TM-2002-210004/Rev3 2: 231-257.
Neveux, J. and F. Lantoine 1993. spectrofluorometric assay of chlorophylls and phaeopigments using the least squares approximation technique. Deep-Sea Research 40: 1747-1765.
Sosik, H.M. 1999. Storage of marine particulate samples for light-absorption measurements. Limnology and Oceanography 44: 1139-1141.
Vaulot, D. 1989. CYTOPC : processing software for flow cytometric data. Signal Noise 2: 8.
Vodacek, A., N.V. Blough, M.D. DeGrandpre, E.T. Peltzer, and R.K. Nelson 1997. Seasonal variation of CDOM and DOC in the Middle Atlantic Bight : Terrestrial inputs and photooxidation. Limnology and Oceanography 42: 674-686.