
USER GUIDE
Click here to download the pdf
Authors : Stéphane Gasparini and Elvire Antajan
Last Modified : 16/10/13
Please submit all bugs / corrections for this documentation or the Plankton Identifier software to Stephane Gasparini or Elvire Antajan
NOTE: Any figures shown one this page are liable to radical change. The visual interface is still undergoing active development (we are trying to make it easier to use and more intuitive).
Original variables, customized variables and identification groups
Visualize a prediction from a Pred_.txt file
Check an existing Validated set
Build its own analysis method (tdm)
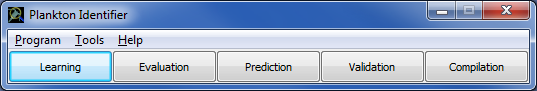
When launching the application, 5 buttons are available: "Learning", "Evaluation", "Prediction", "Validation" and "Compilation" (Fig.1). These 5 steps can be run independently. However, "Evaluation" and "Prediction" use files generated by "Learning", "Validation" uses files generated by "Prediction" and "Compilation" uses files generated by "Validation". Thus, the very first time you run Plankton Identifier you must begin with "Learning".
A menu is also available:
Program > Settings allows to define the location of Tanagra.exe as well as a default folder for thumbnails, PID files and results.
· Tanagra Path: If more than one version of Tanagra is installed on the computer, you can select the version you want to use. Click Browse, browse the hard drives until you find Tanagra.exe, select it and click OK.
NOTE: If you did not install Tanagra in \Program Files\Tanagra, or if you did not install Tanagra at all, this window will pop up automatically when running Plankton Identifier (Fig.2).
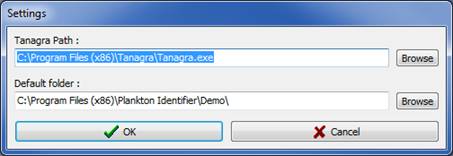
Figure 2: Settings window
· Default folder: The default folder will be the starting folder for the different steps the very first time you use them. When installing Plankton Identifier, the default folder is the "Demo" folder of the Plankton Identifier install directory. Thereafter, the starting folder will be the last folder successfully used except if you have deleted that folder in between (then it will be the default folder). If none of these folders exists anymore, "My documents" will become the default folder. To change the default folder, click Browse, browse the hard drives until you find the folder you want as default folder, select it and click OK.
Program > Exit closes Plankton Identifier.
Tools > Import Tanagra Data Mining diagram helps to import data analysis methods for evaluation or prediction created with Tanagra and saved as a tdm into Plankton Identifier. When the window opens, browse the hard drives, select the tdm file to be imported, and click open. The routine verifies if the selected tdm can be used in Plankton Identifier, adapts it if necessary, and makes a copy in the appropriate subfolder (Plankton identifier install directory \ tdm_Eval or tdm_Class).
NOTE: A successful import does not mean that the method will work. Please refer to the section "Build customized data analysis method" for more information.
Tools > Import Name List helps to import a name list (for groups / subfolder creation) into Plankton Identifier. When the window opens, browse the hard drives, select the text file to be imported, and click open. The routine verifies if the selected text file can be used in Plankton Identifier, and makes a copy in the appropriate subfolder (Plankton identifier install directory \ Lists).
NOTE: The text file must contain group names separated by line feeds without duplicates and without any special characters.
Tools > Concatenate Learning Files helps to concatenate existing Learning Files or to create a test file from two Learning files. When the window opens, click browse next to Learning File 1 to select the first Learning file, then click browse next to Learning File 2 to select the second Learning File. In the Learning File 2 Status section, select Learning if you just want to concatenate selected files or select Test if you want to create a Test File. Then, click OK and use the save dialog box to select a destination folder and a file name. When you click on save, the new file is created.
NOTE 1: Variables of the two learning files must be strictly identical otherwise a warning message will be displayed.
NOTE 2: Concatenation must be used with care if some objects are present in both original learning files, the concatenated one will contain duplicates. Please refer to the section "Evaluation" for more information about the use of concatenated Learning files.
Help > Online User Guide leads to this web page.
Help > Online FAQ leads to the Frequently Asked Questions web page.
Help > About Plankton Identifier shows Plankton Identifier author information.
This step generates a file (Learning file) containing needed information for automatic recognition. It corresponds to a representative sub sample of objects (Learning set) identified by an expert and used as reference in further analysis.
When clicking on the Learning button, a folder selection window appears (Fig.3). Select a folder which will contain a "Learning Set" corresponding to identified objects (thumbnails .jpg) sorted into subfolders (groups) + PID files containing object metadata.
· To create a new learning set, you must select an empty folder. If necessary, you can create it by clicking on the new folder icon (Fig.3: 1) and entering a new name (Fig.3: 2). Then click on the OK button (Fig.3: 3).
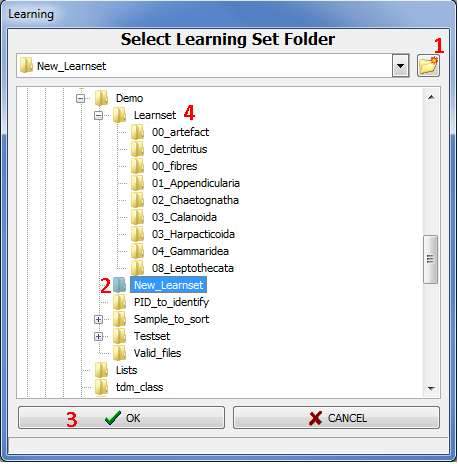
Figure 3: Select Learning Set Folder window
· You can also select a folder already containing a learning set (Fig.3: 4). This existing learning set can be an old one you want to modify or a learning set made by other means.
NOTE: if the content of the selected folder does not fit the expected structure or contains invalid data you will not be able to open it and a warning message explaining the problem will appear in red at the bottom of the window.
Once you have selected a valid folder for thumbnails sorting and have clicked OK, a new window appears (Fig.4). The left panel of this window (“Sample Set”) allows browsing the hard drives to select samples with unsorted objects (thumbnails) and the right panel (“Learning Set”, empty for a new learning) corresponds to identified objects (thumbnails) sorted into subfolders (groups).
NOTE: Relative size of these different panels can be changed by dragging borders.
In "Sample Set" panel, browse the hard drives to open a folder containing unsorted thumbnails and their associated PID files. Only thumbnails with a valid name (<Sample Name>_<Item Number>.jpg) will be displayed. If the name is valid but the required data cannot be retrieved, a red question mark will be drawn on the thumbnail (Fig.4: 1) and you will not be allowed to use it. If you place the mouse cursor above the question mark, the reason why required data cannot be retrieved will be displayed (PID file missing, Item missing in the PID file etc.). If the thumbnails appear too small or if you cannot read their names entirely, you can use the “thumbnails size” bar on the left to enlarge them (Fig.4: 2).
NOTE: In \Program Files (x86)\Plankton Identifier\Demo\Sample_to_sort\, some folders, containing thumbnail images and the corresponding PID file, are available for exercising.
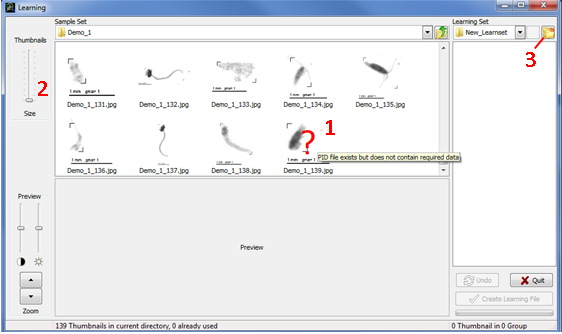
Figure 4: Learning window
In "Learning Set" panel, folders must be created to sort the thumbnails according to their identification. Click on the Create new folders icon (Fig4: 3). It will open a new window which allows the selection of predefined names (Fig.5). If the desired name is not available, you can either select another predefined list or select “new” as name and edit it later in the “Learning Set” panel. When you click OK, all the selected names are created as subfolder in the “Learning Set” panel. To edit a folder name, select the folder by a single click, then click again on the name to activate edition.
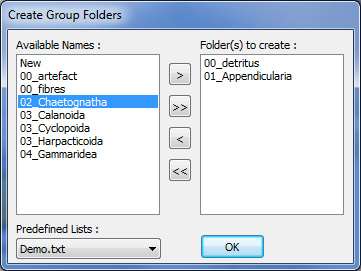
Figure 5: Create Groups Window
NOTE 1: The same folder name cannot be used twice in a learning set. Thus, already used name are not available in the “Create Group Folders” window and any edition of folder name leading to an already existing name will be automatically cancelled.
NOTE 2: In "Learning Set" You can open a subfolder and create sub-subfolders in the same way. However, creation of subfolders into subfolder is not recommended since further statistical analyses do not use tree structure as valuable information. Only the name of the last folder containing thumbnails will be used as identifier and complex tree structure could create more confusion than advantages.
NOTE 3: Using the Windows notepad, you can also create your own customized lists or edit an existing list in the “Lists” subfolder of the Plankton Identifier folder. Customized lists will be then available in the Predefined Lists combo-box. A customized list must contain group names separated by line feeds, without duplicates and without any special characters. You can use Tools>Import Name List in the main window menu to import your own list.
When selecting a thumbnail, a preview appears (Fig.6: 1). You can enlarge that preview with the Preview zoom buttons on the left (Fig.6: 2). You can also play with contrast and light bars to focus your attention on some details of the preview.
Drag thumbnails to the corresponding subfolders (Fig.6: 3). When you release a thumbnail on a subfolder, this thumbnail is physically copied (not moved) in the subfolder. The corresponding PID file is also copied in the learning folder but remains invisible to avoid confusion. Once a thumbnail has been used in the current learning set, a red cross is drawn on it (Fig.6: 4) and you will not be allowed to use it anymore.
Selection of several thumbnails at once is possible if you maintain the Ctrl key down during selection. If you want to see the preview of each thumbnail during a multiple selection, then start selection from the down right to the upper left thumbnail position in the panel.
The number of thumbnails in each subfolder is drawn on it and is updated after each drop. The total number of sorted thumbnails, and of those to be sorted, are indicated at the bottom of each panel (Fig.6: 5).
You can sort thumbnails from several sample sets to build your Learning set. Clicking on the Up one folder level button (Fig.6: 6) brings you to the parent folder of your current location.
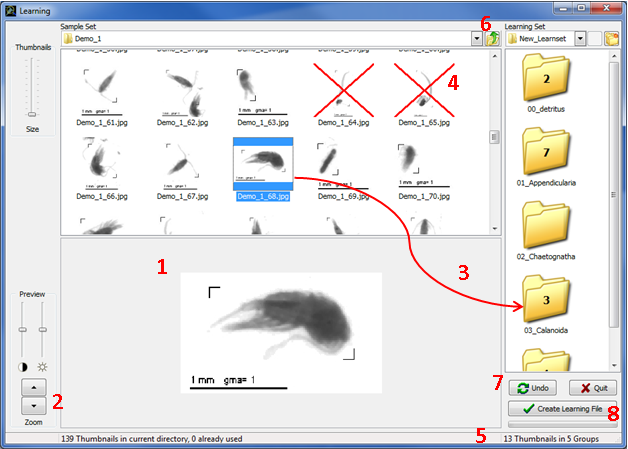
Figure 6: Thumbnails sorting
To cancel a drop you can (1) use the Undo button (Fig.6: 7) or (2) open the subfolder, select the thumbnail and delete it with the DEL key.
The Undo button can also be used to cancel deletion or subfolder creation. The DEL key can be used to delete a subfolder once it has been cleared out of thumbnails.
NOTE: The Undo button can cancel an unlimited number of actions until you create a Learning File or you quit the Learning Window.
Once you consider you have sorted enough objects in each category, click on the Create Learning File button (Fig.6: 8). A save dialog box will appear. Indicate a destination folder and a name for the learning file if you do not want to keep the default name (which is Learn_ <number>). Click on the Save button and the job is done. Then, a dialog box asks you if you want to continue sorting. If you choose “No”, the learning window is closed and the main window is enabled.
The evaluation step helps you to assess how accurately the predictive model built with your learning set will perform to recognize objects according to the groups defined in your learning set. This step generates text files containing the results of the learning set evaluation as well as an html report containing data analysis information. Click the Evaluation button in the main window, a new window opens with different panel sections (Fig. 7):
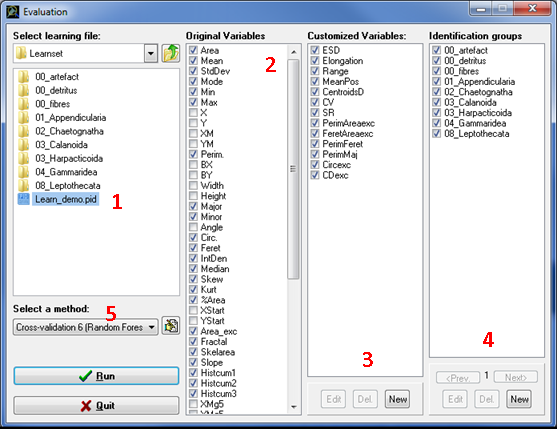
Fig. 7: The Evaluation window
Select learning file (Fig. 7: 1)
This section allows browsing the hard drives to select the learning file you want to use for analysing your data.
NOTE 1: A learning file must be selected to activate other sections.
NOTE 2: A double click on any PID file (learning or sample) will automatically open it in PID viewer (if installed) or in your text editor (i.e. Windows Notepad). Thus you can easily verify its content if necessary.
Original variables (Fig. 7: 2)
This section shows the variables available in the selected learning file. You can enable or disable the variables to be used for the analysis. Disabled original variables will be ignored for computation but will not be removed from result files.
NOTE: For those who use the ZooProcess software to generate PID files, the list of original variables to disable before running the computation can be found in annexe.
Customized variables (Fig. 7: 3)
This section helps to create new variables from existing original ones. Thirteen customized variables that you can enable or disable are already available when you install Plankton identifier. Disabled customized variables will be ignored for computation and will not appear in result files. If an existing customized variable cannot be calculated from original variables which are currently available, this variable is automatically disabled and appears in grey.
· To edit an existing customized variable, select it and click on Edit to open the Customized Variable window (Fig. 8).
· To erase definitely an existing customized variable, select it and click on Del.
· To create a new customized variable, click on New to open the Customized Variable window (Fig. 8).
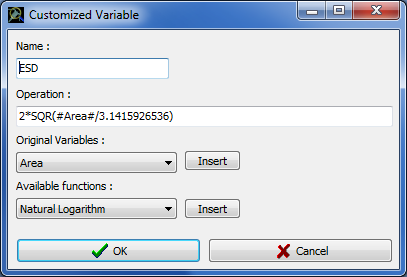
Figure 8: Customized Variable window
NOTE: To write a formula, keyboard operator (e.g. +, -, /,*, ^), standard brackets and numbers can be used as usual. For constant (e.g. numbers), the decimal separator is ".". To insert one of the original variables, select it using the "original variable" box, and press Insert. Variable name will appear surrounded by "#" (do not remove these marks without removing the whole variable name). To insert a function, select it using the "Available functions" box, and press Insert. We recommend looking at already existing customized variables (use Edit) to see how to build new formula.
Identification Groups (Fig. 7: 4)
This section shows the Identification groups defined in the selected learning file. The original group list (#1) cannot be deleted or edited. However you can create new groups by grouping existing groups.
· To create new groups, click on New to open the Groups Edition window (Fig. 9).
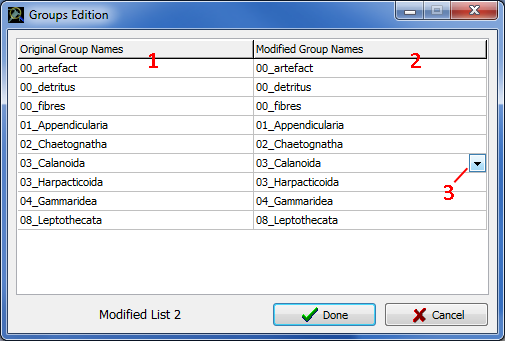
Fig. 9: The Groups Edition Window
· To change original group names (Fig. 9: 1):
NOTE: You can create as many lists of Identification groups as you want. The list used in the analysis will be the current list (i.e., the one visible in the Evaluation window when you will click on Run). You can use the <Prev. and Next> buttons to select the list you want to use for the analysis. In the result files, the original names will appear in the column "Ident" and the new names in the column "Ident2", if used.
NOTE 2: New groups definition will apply even if you select another Learning file having different original group names. In this case, only group names already encountered will be redefined.
· To edit an Identification Groups list, use the <Prev. and Next> buttons to select the list then click Edit to open the Group Edition window and proceed as above (Fig. 7: 4).
· To delete the current Identification Groups list, press Del (Fig. 7: 4).
Select a method (Fig. 7: 5)
This section allows the selection of an evaluation method to test accuracy of prediction using a supervised learning method and the learning file selected. Two kinds of evaluation method are proposed within Plankton Identifier.
k-fold cross-validation method: evaluates supervised learning algorithm accuracy on the learning file using a re-sampling technique. The original learning set is randomly partitioned into k subsets of the same size. Each time, k-1 subsets are put together to form a learning set used to build the predicting model, and the remaining subset is retained as validation data for testing the model. Each subset will be used once as testing set and k-1 times as learning set. The k results from the testing sets are then averaged to produce a single estimation of the predicting model performance. The cross-validation process is repeated n times and the average error rate of the n cross-validations are computed in a confusion matrix.
· Eight cross-validation methods are implemented within Plankton Identifier, each using a different supervised learning algorithm (see PREDICTION for a description of these algorithms).
· All the cross-validation methods proposed are parameterised with k = 2 and n = 5. To modify these values:
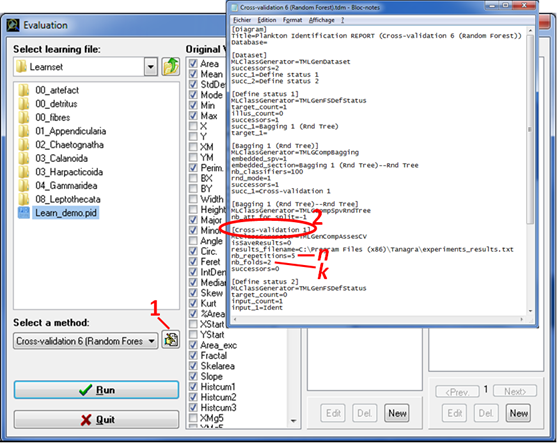
Fig. 10: Modification of cross-validation parameterisation
Test method: evaluates supervised learning algorithm accuracy performances on a predefined and independent test file. Before using a test method, a special file must be created with the tool Concatenate Learning Files (main window menu). Rather than using two distinct files for the learning and the testing set, we prefer join them together in a single file and use the column Status to indicate the role that each observation must play. The learning data (Status = Learning) will be used in the learning process to build the prediction model (or classifier) whereas the testing data (Status = Test) will be used to obtain an unbiased error rate evaluation.
· Two test methods are currently available within Plankton Identifier. Test 1 helps in choosing the best supervised algorithm to use by comparing the eight algorithm accuracy performances at once on the predefined test file. Test 2 used only the Random Forest algorithm.
NOTE 1: The learning and testing set are assumed to be representative of the same set of observations.
NOTE 2: Generally, the larger is the learning set, the better is the classifier and the larger is the testing set the more accurate is the predictive accuracy, or error estimation.
Export to text file (no analysis): generates a text file containing the selected learning file with all the original variables + selected customized variables but without any prediction. This text file can be then imported in any data mining software for analysis.
When all files, variables and identification groups are selected, click on the Run button. A save dialog box will appear. Indicate a destination folder and a name for the result file if you do not want to keep the default name (which is Eval_ <number>). Click on the Save icon and the analysis is launched.
Once the analysis is finished (it can take several minutes depending on the sample size and the selected method), the results and the html report are saved in the selected destination folder, and the html report opens automatically. A dialog box asks you if you want to quit the Evaluation window. If you choose “Yes”, the Evaluation window is closed and the main window is enabled.
The Html report (Fig. 11) is the one of Tanagra. The left panel shows the data analysis diagram. When clicking on one item of this diagram, corresponding information are shown in the right panel. In Figure 11, for example, a click on "Univariate discrete Stat 1" on the left shows the distribution histogram of predicted object identifications on the right. Copy-Paste can be used to export this information towards another software. Please refer to Tanagra documentation (here) for more information about diagram items and results interpretation.
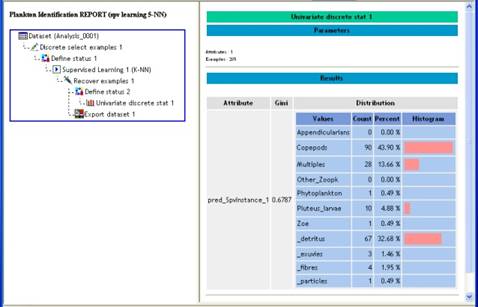
Figure 11: Html report
Compared to the original PID file, the Evaluation file(s) contain(s) several new columns:
IMPORTANT: Columns Ident and Ident2 of the result(s) file(s) correspond to visually identified object when the object status is "Learning" but are meaningless when the object status is "Sample" (just filled with the first group name of the Learning File).
The prediction step allows automatic recognition of samples according to identification groups available in the learning file selected. This step generates text files containing the results of the automatic recognition as well as an html report containing data analysis information. Click the Prediction button in the main window, a new window opens with different panel sections (Fig. 12):
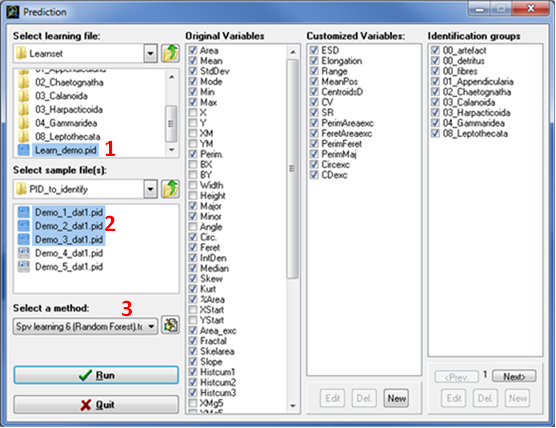
Fig. 12: The Prediction window
Select learning file (Fig. 12: 1)
This section allows browsing the hard drives to select the learning file you want to use for analysing your data.
NOTE: A learning file must be selected to activate other sections.
NOTE 2: A double click on any PID file (Learning or sample) will automatically open it in PID viewer (if installed) or in your text editor (i.e. Windows Notepad). Thus you can easily verify its content if necessary.
Select sample file(s) (Fig. 12: 2)
This section allows browsing the hard drives to select one or more samples (PID files) for which you want to do the automatic object identification.
NOTE 1: To analyse several samples (PID files) at one time, put them in the same subfolder and maintain the 'crtl' Key down during selection as in Windows shell.
NOTE 2: Variables of selected samples (PID files) must match Learning file variables otherwise an error message will be displayed and analysis is not allowed.
Original variables, customized variables and identification groups
See Evaluation above for more details on these sections
Select a method (Fig. 12: 3)
This section allows the selection of a supervised learning method. Eight supervised learning methods are provided within Plankton Identifier.
Spv learning 1 (5-NN): k-nearest neighbour used HVDM distance metric
Spv learning 2 (C-SVC linear): Support Vector Machine for linear Classification from LIBSVM1 library
Spv learning 3 (C-SVC RBF): Support Vector Machine for non-linear Classification from LIBSVM1 library
Spv learning 4 (BVM): Ball Vector Machine from LIBCVM library
Spv learning 5 (C4.5): Decision tree algorithm (Quinlan, 1993)
Spv learning 6 (Random Forest): (Breiman, 2001)
Spv learning 7 (PLS): Partial Least Squares Discriminant Analysis
Spv learning 8 (Multilayer Perceptron): Multilayer Perceptron neural network
1 http://www.csie.ntu.edu.tw/~cjlin/libsvm/
Export to text file (no analysis): generates a text file containing a concatenation of the learning file and sample file(s) selected, with all the original variables + selected customized variables + edited groups but without any recognition. This text file can be then imported in any data mining software for analysis.
When all files, variables and identification groups are selected, click on the Run button. A save dialog box will appear. Indicate a destination folder and a name for the result file if you do not want to keep the default name (which is Pred_ <number>). Click on the Save icon and the analysis is launched.
Once the analysis is finished (it can take several minutes depending on the sample size and the selected method), the results and the html report are saved in the selected destination folder, and the html report opens automatically. A dialog box asks you if you want to quit the Prediction window. If you choose “Yes”, the Prediction window is closed and the main window is enabled.
Compared to the original PID file, the prediction file(s) contain(s) several new columns:
IMPORTANT: Columns Ident and Ident2 of the result(s) file(s) correspond to visually identified object when the object status is "Learning" but are meaningless when the object status is "Sample" (just filled with the first group name of the Learning File). Look at the last column (Pred_Instance or Pred_Bagging) for predicted object identification.
NOTE: If you want to create a separate result file, keeping the original Header, for each sample (PID file) used in the analysis, keep the checkbox Save detailed results for each sample under the Run button enable before launching the analysis. These files are created in addition to the main result file with names as follows: <Result File Name>_<sample name>.txt
This step facilitates automatic sorting of the thumbnails according to the prediction file results and visual validation of the classification by an expert. This step generates a Valid text file containing the results of the automatic recognition plus the validation made by the expert. Click the Validation button in the main window, you are asked to choose between to options, Fig 13:
· Visualize the result of a prediction from a Pred_.txt file (obtained with the Prediction function). This will sort the thumbnails according to the Prediction file and allow you to check and correct the results of automatic recognition.
· Re-open an existing validation set either to continue a validation or to double-check a validation.
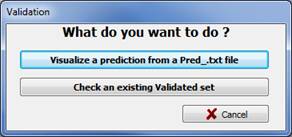
Figure 13: Validation window: What do you want to do?
Visualize a prediction from a Pred_.txt file
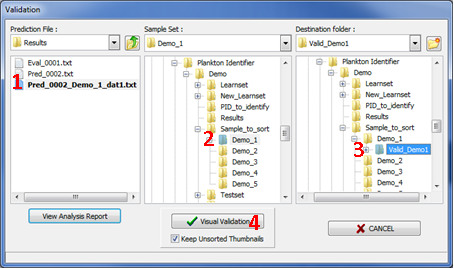
Figure 14: Selection window for Validation 1
NOTE: In the Validation window (Fig. 14), the last prediction file appears in bold characters in the Prediction File section (Fig.14: 1). It is possible to browse the hard drive to retrieve results of previous analysis. You can also double click on the prediction file to open it in the default text editor (i.e. notepad).
NOTE 2: During sorting process the thumbnails are not moved to the destination folder but copied. If you do not want to keep the set of unsorted thunmbnails you have the possibility to delete them automatically by disabling the checkbox Keep Unsorted Thumbnails (Fig. 14: 4).
Check an existing Validated set
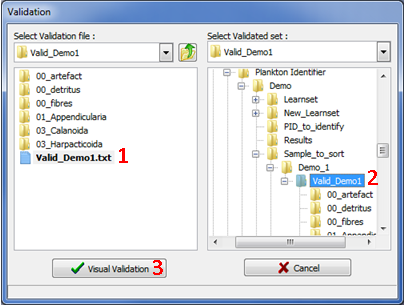
Figure 15: Selection window for Validation 2
The two previous selections open the following Validation window (Fig. 16):
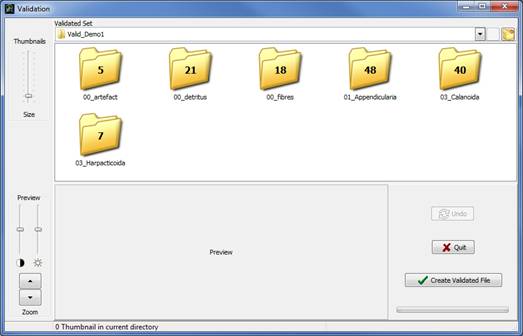
Figure 16: Validation window
The thumbnails have been sorted in subfolders corresponding to the identification groups they belong to (according to Prediction results). Double click on each subfolder to see the thumbnails and check if they were correctly classified.
When selecting a thumbnail, a preview appears (Fig.17: 1). You can enlarge that preview with the Preview zoom buttons on the left (Fig.17: 2). You can also play with contrast and light bars to focus your attention on some details of the preview.
If a thumbnail is incorrectly classified, right-click on it and use Move to for selecting the right identification group in the list (Fig. 17: 3) or create a new folder if the correct identification group is not in the list. Selection and moving of several thumbnails at once is possible if you maintain the Ctrl key down during selection. If you want to see the preview of each thumbnail during a multiple selection, then start selection from the down right to the upper left thumbnail position in the panel.
Clicking on the Up one folder level button (Fig.17: 4) brings you to the parent folder of your current location (disabled when you are at the validation set level, Fig. 16).
The number of thumbnails in each subfolder is drawn on it and is updated after each moving (Fig. 16). Subfolder can be deleted only if there is no thumbnail in it (otherwise this option is disabled). To edit a subfolder name, select the subfolder by a single click, then click again on the name to activate edition.
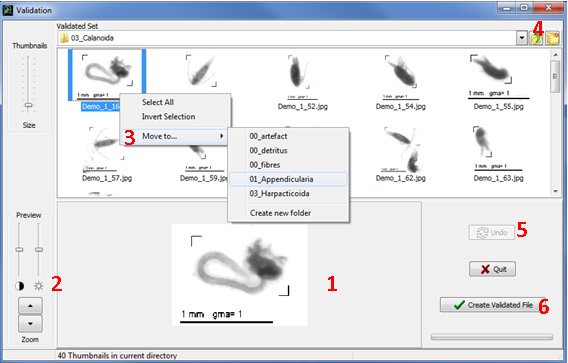
Figure 17: Thumbnails moving in Validation window
To cancel action you can use the Undo button (Fig.17: 5).
NOTE: The Undo button can cancel an unlimited number of actions until you create a Validated File or you quit the Validation Window.
Once you have checked and corrected all the identification groups, click on the Create Validated File button (Fig.17: 6). A save dialog box will appear. Indicate a destination folder and a name for the learning file if you do not want to keep the default name (which is Valid_ <number>). Click on the Save button and the job is done. Then, a dialog box asks you if you want to continue validation. If you choose “No”, the learning window is closed and the main window is enabled.
Compared to the original prediction file, the validation file contains a supplementary column, named Valid, containing validated identification.
Note: If you have selected a Pred_.txt file containing header with all metadata sample information to do the validation, then the Valid_.txt will also contain this header.
This compilation step helps you to concatenate validation files and calculate the number of item per identification group. This step generates text files that can be imported easily in databases. Click the Compilation button in the main window, a new window opens with different panel sections (Fig. 18):
IMPORTANT: This compilation step uses only Validation file(s) containing a header; it does not work with validation file(s) without header.
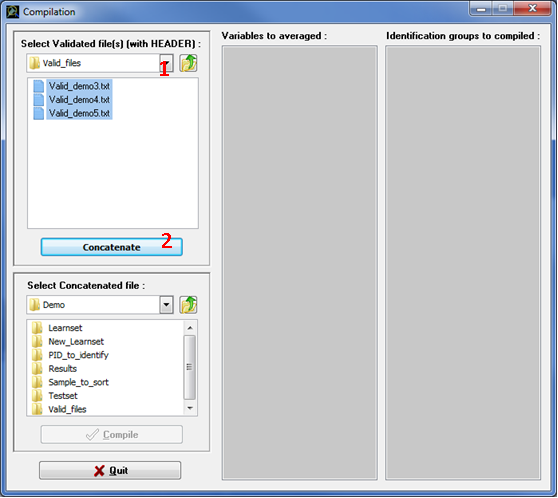
Figure 18: Compilation window: Concatenation step
NOTE 1: To concatenate several Valid_.txt files at one time, put them in the same subfolder and maintain the 'crtl' Key down during selection as in Windows shell.
NOTE 2: This step generates a file containing only the data part of the validation file(s) plus two columns that report information from the header: SubPart and FracId (this is the reason why only Validation files with header can be used in compilation step!).
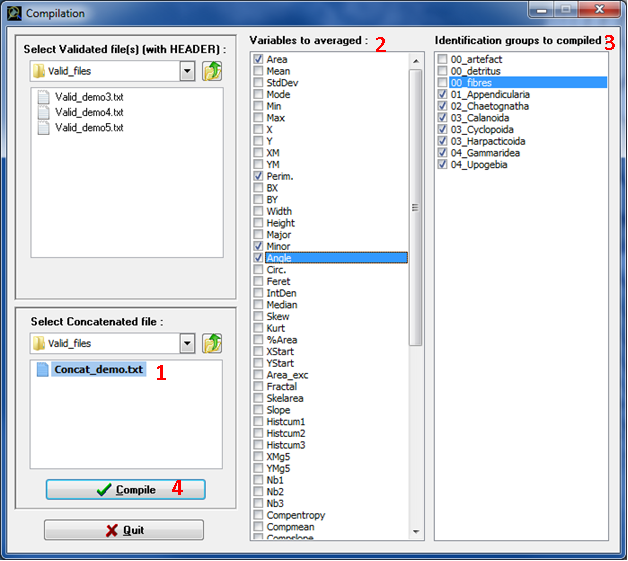
Figure 19: Compilation window: compilation step
The compilation file contains the following columns (Fig.20)

Figure 20: Compilation file
To work with the current version of Plankton Identifier, PID files and thumbnails in jpeg format are needed. Both are generated by other software such as ZooProcess. Plankton Identifier is also compatible with ZIM files generated by Zoo/PhytoImage with the exception of the compilation step.
A PID file collects object information about one image corresponding usually to one sample (or sub-sample) in the real world. Each PID file is basically a text file very similar to a MS Windows initialization file (.ini). The first line contains a signature (PID) and is followed by different sections. Each section starts with a section declaration, which corresponds to section name surrounded by square brackets [ ].
The first sections contain information about the sample, sample processing and image acquisition etc. In these sections, forming the header, each information item is made up of an item name, equals sign ('='), and a value.
The last section, [Data], contains object measurements. Only this last section is used by the current version of Plankton Identifier. The first line of this section contains column names (i.e. variable names) separated by semicolons (;). The other lines contain corresponding data (one line per object) also separated by semicolons.
The first column must correspond to a unique number identifying the object in the sample, and the second column must correspond to the sample name. Other columns correspond to object measurements. The number of values must be the same in all lines.
NOTE: variables locating objects in the original image are required for post processing including visual validation, but not for automatic recognition.
More information about PID files is available in the ZooProcess manual.
Each thumbnail corresponds to the image of one object in the original image. The jpeg format has been chosen because thumbnails are used for visualization only and not for measurements. In such conditions, image degradation due to jpeg compression is not a problem and jpeg format preserves a lot of disk space.
To be used with Plankton identifier, the name of each thumbnail must contain a prefix, identifying the corresponding PID file, and a suffix, identifying the object in the [Data] section of the PID file, separated by an underscore “_”. If several underscores are present in thumbnail name, only the last one is considered as separator.
The prefix must correspond exactly to the beginning of the name of the corresponding PID file but the end of PID file name can include some additional comments. For example, a thumbnail named DEMO1_24.jpg can correspond to a PID file named DEMO1(zoopk).pid. Of course, equivocal situations must be avoided:
Example 1:
Bad situation: DEMO1_24.jpg coexists with DEMO1_Test1.pid and DEMO1_test2.pid.
Solution: Use DEMO1_Test1_24.jpg or DEMO1_Test2_24.jpg as thumbnail name.
Example 2:
Bad Situation: DEMO1_24.jpg coexist with DEMO1(zoopk).pid and DEMO10(phytopk).pid.
Solution: Change DEMO1(zoopk).pid to DEMO01(zoopk).pid and use DEMO01_24.jpg as thumbnail name.
The suffix corresponds to the object number in the first column of the [data] section of the PID file, meaning that the same number must not be use twice in the same PID file.
Before sorting (see LEARNING), thumbnails are expected with their associated PID file in the same folder by Plankton identifier.
Learning Files are generated and used by Plankton identifier. These are text files with a .pid extension but differ from original PID files (see above). The first line contains another signature (LEARNING) to avoid confusion. The second line contains column names (i.e. variable names) separated by semicolons (;) and the other lines contain corresponding data (one line per object) also separated by semicolons. Compare to the [Data] section of original PID files, a Learning File contains data of identified objects only as well as two additional columns. The first additional column is named “Ident”, and contains the name attributed to the object by an expert. The second additional column is named “Status”, and contains the word “Learning” in order to differentiate the Learning part in further concatenated files.
Test files are special Learning File resulting from the concatenation of two Learning Files, one receiving the word "Test" rather than "Learning" in the column "Status". Test file associated to specific tdm are useful to evaluate the efficiency of a Learning File.
In order to preserve flexibility and control by the users, many files and folders are created during the different process and can be accessed using Windows shell. If you do not take care of files and folders organization, the situation will quickly become confusing.
The use of one folder per project is highly recommended with at least the following subfolders:
See the "Demo" folder provided with Plankton Identifier for an example.
A “Learning Set" corresponds to one folder containing PID files and thumbnails sorted into subfolders. In opposition to folder containing unsorted thumbnails, in a “Learning Set” PID files are not stored in the same subfolder as thumbnails but in the root folder. For this reason, if you try to use a “Learning Set” as source of unsorted thumbnails, these later will appear with red question marks in the Plankton Identifier “Learning” window (and even with question marks and crosses if copies of these thumbnails are already used in the current Learning Set). Thus, unintended cross-sorting is impossible.
The name of the subfolder containing a thumbnail is used to fill the column “Ident” of the corresponding object when creating a Learning File. This is the reason why all the different subfolders must have different names even as sub-subfolder.
A “Learning Set” is valid only if all the thumbnails it contains have the corresponding PID file in the root directory (See the “File formats and File Names” section for information about naming convention). A “Learning Set” can contain additional files such as text files with some comments, Learning Files or unused PID files but jpeg images other than thumbnails are not allowed.
Build its own analysis method (tdm)
Plankton identifier uses Tanagra tdm files to register data analysis methods. These tdm files are stored in the “tdm-Eval” or “tdm-Clacc” subfolder of the Plankton Identifier install directory. To add a customized data analysis method to Plankton Identifier a tdm file must be created using Tanagra then imported in this subfolder. Because it is not Plankton identifier purpose to reproduce all Tanagra functionality, a tdm file compatible with Plankton Identifier has some limitations and must comply with the following rules:
· It must contain at least a component “Define status 1” and a component “Export data set 1”.
· “Define Status 1” must contain measurements as input (continuous variables) and “Ident” as target (discrete variable)
· If others “define status” are used, they cannot make reference to measurements as input or as target (but they can make reference to discrete variables, or to outputs of previous components)
· Other components such as “Continuous select examples” cannot make reference to measurements or to “Ident” (Only “Define status” components can make reference to “Ident”)
Since a tdm file is basically a text file, it can be created or edited using a simple text editor such as the notepad. However, the simplest way to create a new tdm file for Plankton Identifier is the following:
2. Launch Tanagra and select File>New…
3. In the Dataset field, select the previously created text file then click OK.
4. Construct your data analysis diagram (see Tanagra documentation) having in mind the rules described above.
5. Select File>Save as… and save the diagram as “Text data mining diagram” in a temporary folder with an easy to understand name (this name will appear in the select method box of Plankton Identifier)
6. Go back to Plankton Identifier and select “Import Tanagra Data Mining diagram” in the “Tools” menu of the main window.
7. Indicate for what analysis the tdm will be used for (Evaluation or Prediction)
8. Select the newly created tdm file and click Open… The tdm file is copied in the appropriate subfolder (tdm_Eval or tdm_Class) and is now available in the select method box of the Data Analysis window.