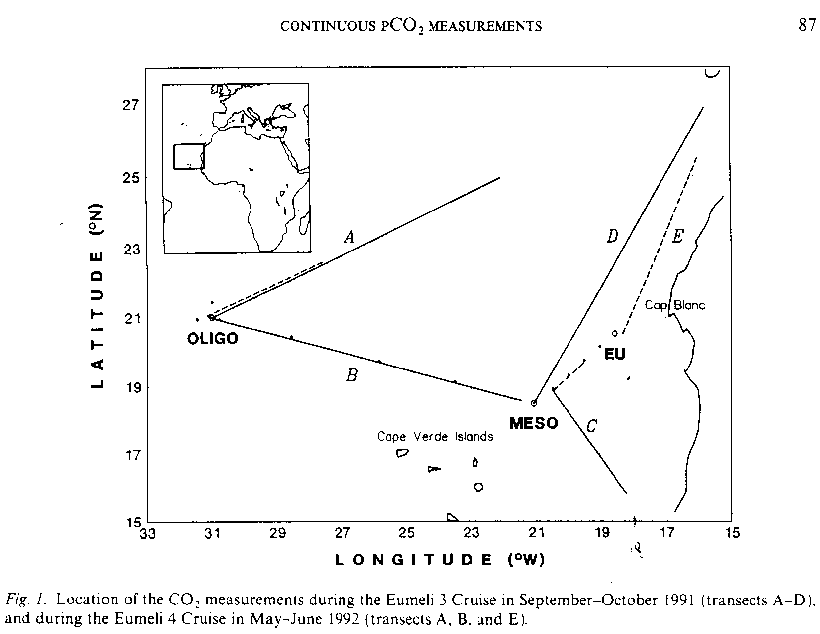
EUMELI - EUMELI 3
L'Atalante
sept. 14 - oct. 24, 1991
G. JACQUES/A. MOREL : head of mission A. MOREL :
![]() Data set pCO2 surface :
C.
COPIN
Data set pCO2 surface :
C.
COPIN
EUMELI - EUMELI 3L'Atalantesept. 14 - oct. 24, 1991 |
|
G. JACQUES/A. MOREL : head of mission A. MOREL : |
|
|

|
MEASUREMENTS of pCO2 in surface water, à temp. in situ
| File name | LAT. | LON. | First Day | Last Day |
|---|---|---|---|---|
| EUM3DAME.DAT.txt | 15.489 | -18.129 | 14.09.91 | 15.06.91 |
| EUM3MO1.DAT.txt | 18.378 | -21.777 | 18.09.91 | 20.09.91 |
| EUM3OLLA.DAT.txt | 20.582 | -31.047 | 25.09.91 | 27.09.91 |
| EUM3LPME.DAT.txt | 26.524 | -15.491 | 04.10.91 | 06.10.91 |
| EUM3MEOL.DAT.txt | 18.350 | -21.281 | 10.10.91 | 12.10.91 |
METHODS
The measurements were performed on water pumped at the bow to supply the shipboard thermosalinometer. The water flow was directed to a debubbler and then to the various measurements systems. The measurements and acquisition methods have been previously described in detail (Copin-Montegut and Raimbault, 1994).
The chlorophyll fluorescence was measured with a Turner Design fluorometer, the pCO2 measurements were performed according to the method of Copin-Montegut(1985), using a Maihak Infrared Analyser for CO2 model Defor, witha barometric pressure compensation.
Calibrations were made with mixtures of 350+/-0.15ppmv, 213+/-0.15ppmv, and 490+/-0.25ppmv of CO2 in air manufactured by Air Liquide.
The pH measurements were made with a Radiometer 84 pHmeter and a Ross combination electrode (Orion 8102).
As the calibrations and the pH measurements were not performed exactly at the same temperature, a correction for the variation of the liquid junction potential of the electrode with temperature was made. The signal of the quartz temperature probe located at the ship bow was calibrated by comparison with the temperature signal of the CTD Sea Bird probe used during the cruises.
The same procedure was used to correct the salinity given by the thermosalinometer. The data were logged at 1-min intervals. The precisions on the pCO2 and pH measurements were better than 1 µatm for pCO2 and 0.001 units for pH, but the accuracies were lower. They may be estimated to be close to 2 µatm for pCO2 and 0.010 units for pH.
The simultaneous measurements of pCO2 and pH permit the validation of the results. From the
alkalinity measurements on discrete samples along transec D (using the method described by Copin-Montegut, 1993),
a linear relationship between total alkalinity (TA) and salinity (S) was established :
TA=42.41 x S + 858.4+/-2.0µmole kg-1, at the 95% confidence level.
Then pCO2 was calculated from pH and TA (deduced from salinity) using the dissociation constants of Goyet and Poisson (1989) for carbonic acid, that of Dickson (1990) for boric acid, the Weiss (1974) equation for the solubility of CO2, and the ionic product of water determined by Dickson and Riley (1979).
The standard deviation between the measured and calculated values was 1.2 µatm for 2283 samples along transect D.